Basic Postmortem Of Windows Process
PART I. ( Understanding Tools To Be Used )
Every application / driver comprises of processes and threads. Every process has the following
- Virtual Address space
- Executable code
- One executable thread ( MUST ) /div>
Windows Debugging - Basics
My article is specific to debug Microsoft applications and drivers written for Windows operating systems. Following are some of the utilities that every developer should know and use.
- Visual Studio ( All versions )
- ADPlus
- Windbg
- DebugDiag
- BoundsChecker ( compuware )
- Purify ( IBM )
Points To Be Noted:
a) Applications developed using .NET can take advantage of DebugDiag utility and then use Windbg side-by .
b) Driver developers can rely on Windbg. There was another classic tool “softice” which is no longer supported
c) Applications developed in MFC / ATL / C++ / C# can take advantage of Visual studio inbuilt debug functionality and can use windbg side-by.
PART II. ( Preparing Debugging Environment )
Configuring Windbg Utility:
One of the best utility used by Microsoft / debuggers to debug applications / drivers is Windbg. You can download windbg from the following website http://www.microsoft.com/whdc/devtools/debugging/default.mspx . You can either download 32bit / 64bit installable. After downloading the utility, we have to configure it accordingly. Microsoft always assists newbie’s to use “help file” which exposes all the relevant documentation required to understand their product. Following are the immediate steps required once you have installed windbg utility.
Configuring Symbol File Path:
This is the next immediate step after you download and install the Windbg utility. Symbol files contains the following information
- Function names and addresses
- Global variables
- Local variables
- Frame pointers
All of the above are bundled into a file called .pdb .These .pdb files are generated when you execute the program ( specifically the linker creates these .pdb files ). The location of these .pdb files are located in application’s project directory
Eg: c:\DocumentsandSettings\Administrator\MyDocuments\VisualStudio2005\Projects\debugcrash\debug\debugcrash.pdb
The above example belongs to the applications you develop in-house, but in-order to download the symbol files belongs to Microsoft , you need to provide the symbol file path which is provided by Microsoft
Eg: SRV*your local symbol folder*http://msdl.microsoft.com/download/symbols
Symbol file path should be configured under Windbg using following procedure
a) Open windbg
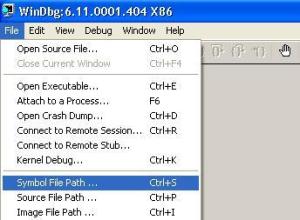
b) Navigate to File à Symbol File Path à provide the location accordingly
IMPORTANT NOTE: When debugging applications related to third party / applications for which you do not have the source code , you need to request the vendor for the .pdb files.
Configure Source File Path:
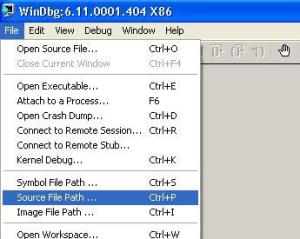
Once you have configured the symbol file path, you should configure the path for your source ( provided you are debugging application / driver which you have developed ). You can do this by navigating to File à Source File Path and provide the location of your executable. (follow image below )
PART III ( Analyzing The Application )
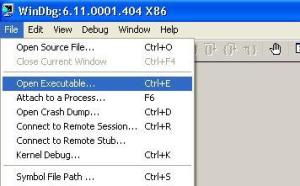
Once you have configured the above settings, its time for us to analyze our application. The final step required is to hook the exe to Windbg which needs to be debugged. You have to open executable using Windbg through windbg à OpenExecutable à provide the path accordingly ( follow the image below )
*Please save the workspace when prompted.
Next step is to reload the symbol using .reload /f command, observe for any errors and resolve them accordingly. There is another way to reload the symbol files , by navigating File à Symbol File Path à reload . After you reload the symbol files, you have to confirm if the symbol files are loaded, this can be done using lm command , which gives you the .pdb files which are loaded by debugger ( follow the screen below )
When you hit lm command , you might see deferred status for modules . Debugger loads the symbols when required so you would see deferred status, in which you can force the symbol to load using .reload /f .
Till now , we have prepared the debugger , configured the symbol files, attached our exe to the debugger. If you are debugging Your application , you can always put the relevant breakpoints to the functions you require, this depends on scenario / behavior of the problem. For this article, I would like to restrict my lab to view process information. For my lab purpose , I have written an MFC application called “Threadtest” with single parent process and single thread.
To view the number of processes in your application, you should use pipe command |* which displays the below information.
My application is using one process and observe the ( dot ) beside ‘0’ which means this process is the current process.
Once we identify the number of processes for an application you are debugging / for driver , you should know more about how the process is built , which includes the different data structures involved , Memory information, Heap, Environment etc.. One of the limitation of Windbg is that it doesn’t provide a way to “step-in” between user mode and kernel mode. There are multiple ways to tackle this behavior
- Launch two debuggers , one in user mode and other in kernel mode and analyze the process or thread activity accordingly.
- Setup Target and Host and debug the process accordingly ( You can look into the help file in windbg how to setup Target and Host scenario )
Why do we need to perform step in to kernel mode ?, cant we analyze the data under user mode context ?
Answer to the above question is NO. In order to analyze the data structures responsible for constructing a process can only be analyzed in kernel mode.
So what are the options available for any user under User Mode ?
Specific to process ( excluding the stack ) , the options provided by windbg is lean. It provides you to analyze
- Number of processes of your application — | , | *
- Active process — | .
- Process which caused exception — | #
In order to analyze the Eprocess / PEB of the process / virtual memory of the process , you can perform the same in KD session. But I tried using !peb <PEB address of a process> under the user mode session and I was able to get the information which was similar running !peb <PEB address of a process> under LKD / KD.
Eg: under user mode running !peb 7ffdc000 will give you below information
!peb 7ffdc000
PEB at 7ffdc000
InheritedAddressSpace: No
ReadImageFileExecOptions: No
BeingDebugged: Yes
ImageBaseAddress: 00400000
Ldr 002524b0
Ldr.Initialized: Yes
Ldr.InInitializationOrderModuleList: 00252568 . 00253048
Ldr.InLoadOrderModuleList: 002524f0 . 002530f8
Ldr.InMemoryOrderModuleList: 002524f8 . 00253100
Base TimeStamp Module
Under kernel mode !peb 7ffdc000
!peb 7ffdc000
PEB at 7ffdc000
InheritedAddressSpace: No
ReadImageFileExecOptions: No
BeingDebugged: Yes
ImageBaseAddress: 00400000
Ldr 002524b0
Ldr.Initialized: Yes
Ldr.InInitializationOrderModuleList: 00252568 . 00253048
Ldr.InLoadOrderModuleList: 002524f0 . 002530f8
Ldr.InMemoryOrderModuleList: 002524f8 . 00253100
This article explains, how to setup the debugger appropriately and hook the application to debug.


